Restaurant Recommendation System
2024
data science / machine learning

"Hmm, I wonder how recommendation systems work. 🤔"
Authors: Yufan Zhang, Ruitian Wu, Tian Jin, Rundong Hu, & Edward Wang
This project presents a restaurant recommendation system developed using Yelp’s public dataset. Our study aims to predict user preferences for new restaurants by integrating various data modeling techniques, focusing on both restaurant features and user interactions. We employed content-based filtering and collaborative filtering methods, including Linear Regression, Random Forest Regression, and Alternating Least Squares (ALS), to construct a multi-faceted recommendation model. Our findings indicate that Linear Regression and Random Forest-based collaborative filtering outperformed other recommendation systems. The study also highlights the limitations of collaborative filtering on sparse datasets.
Background
People nowadays are turning to online platforms more and more for ideas in the real-world context and among all the applications, finding options for dining on platforms like Yelp is one of the most popular. On the one hand, people can actively search for what they want based on categories, locations, and other information. On the other hand, the platform can make recommendations on what the customers would prefer when people don’t have exact targets. Being able to make satisfactory recommendations to the users could definitely help to create a more intuitive and user-centric platform that drives growth for businesses and satisfaction for users, leading to a stronger and more connected Yelp community. So here comes the most important problem to solve: how can we actually predict new businesses that a user might be interested in based on their past reviews, choices, or interactions?
To resolve the problem, we are mainly focusing on two key points: what is the useful information that we need to gather and process from the users, businesses, and their interactions and how can we utilize them to the largest extent? Also, besides simply making predictions, we need to explore how to incorporate additional context (such as location, social influence, and timing) to refine and enhance the relevance of our recommendations. By successfully integrating the two stages together, we are aiming to build such a recommendation system that could take both internal and external factors into account.
Dataset
In this project, we utilize public data provided by Yelp. It contains information about 6,990,280 reviews and 150,346 businesses from 11 metropolitan areas. Concretely, the dataset consists of five JSON files, each for one object type: business, review, user, check-in, and tip. “Business.json” contains business data including location data, attributes, and categories. “Review.json” contains full review text data including the user_id that wrote the review and the business_id the review is written for. “User.json” documents user data including the user's friend mapping and all the metadata associated with the user. All data stored in JSON files follow the format of one JSON object per line.
Analysis (Initial Stage)
I. Data Preparation
We first filtered out the restaurant data from the Business.json file. To obtain the restaurant data, we went through all business categories from the original JSON file, meanwhile indicating the number of occurrences. For the categories occurring more than 30 times (Figure 1), we manually filtered out those related to food and saved them in a list.
food_categories = [
    'Restaurants',
    'Food',
    'Bars',
    'Sandwiches',
    'American (Traditional)',
    'Pizza',
    'Coffee & Tea',
    'Fast Food',
    'Breakfast & Brunch',
    'American (New)',
    'Burgers',
    'Mexican',
    'Italian',
    'Specialty Food',
    'Seafood',
    'Chinese',
    'Bakeries',
    'Salad',
    'Chicken Wings',
    'Cafes',
    'Ice Cream & Frozen Yogurt',
    'Caterers',
    'Beer',
    'Wine & Spirits',
    'Delis',
    'Japanese',
    'Pubs',
    'Cocktail Bars',
    'Sushi Bars',
    'Barbeque',
    'Juice Bars & Smoothies',
    'Asian Fusion',
    'Diners',
]
Eventually, we traversed through all businesses with the food-related category list and utilized a binary indicator “is_restaurant” to mark whether the business could be considered as restaurant data.
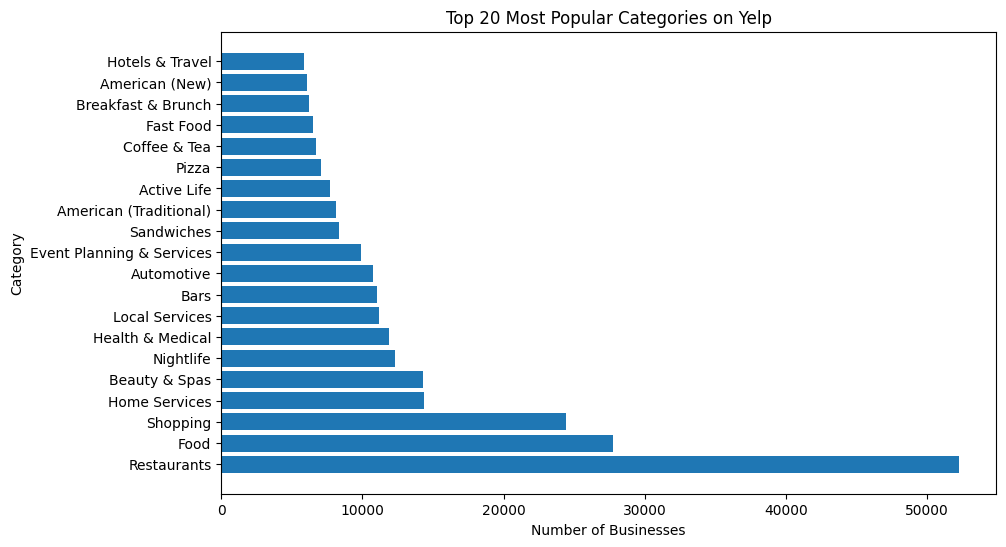
Figure 1. Top 30 most frequent categories of food in the Yelp dataset
II. Feature Exploration
In the original JSON file, every business item contains a set of features stored in a dictionary named “attributes” in the format of key-value pairs. We first went through all the businesses to construct a feature list that contains all the 39 unique features ever existing in the JSON file. Because the features utilized to describe businesses vary from one to another, to ensure a structured dataset for further modeling, we removed those with few occurrences and only kept those that appeared in more than 50 percent of the businesses. Following this threshold, we eventually kept 17 features to describe each business and construct the data for further analysis:
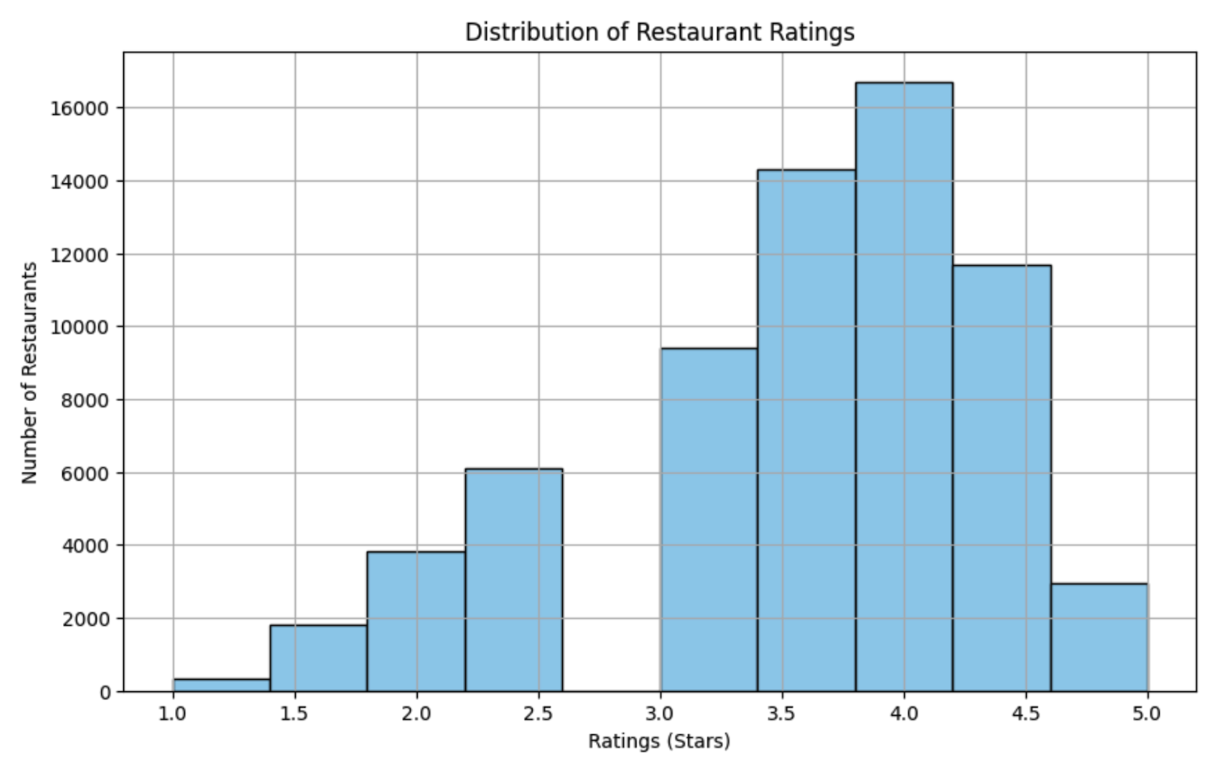
Figure 2. Distribution of Restaurants Average Ratings
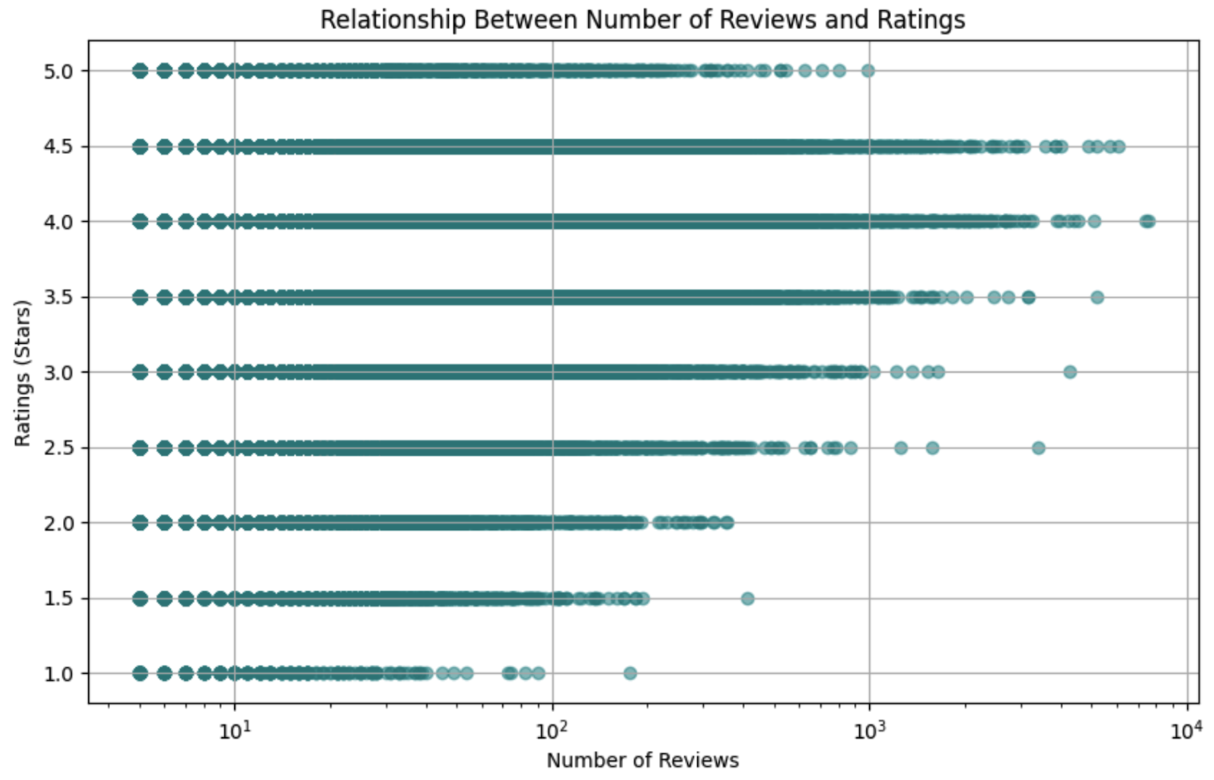
Figure 4. Relationship between the number of reviews and ratings
- Restaurant Ratings: We focus on “RestaurantRatings”, which are normally distributed around 4 but slightly skewed, as illustrated in Figure 2. We will use the original ratings without transformation.
- Number of Reviews: This variable shows the number of reviews each restaurant received. Our analysis (Figure 4) shows no clear trend between the number of reviews and ratings, suggesting ratings vary regardless of popularity.
- Boolean Attributes: These include “Caters”, “RestaurantsReservations”, “BikeParking”, “HasTV”, “RestaurantsTakeOut”, “BusinessAcceptsCreditCards”, “GoodForKids”, “RestaurantsDelivery”, “RestaurantsGoodForGroups”, and “OutdoorSeating”.
- Attributes of direct categorical values: “WiFi”, “RestaurantsPriceRange2”, “Alcohol” “NoiseLevel”
- The “GoorForMeal” attribute: This attribute, indicating meals suitable for dining (dessert, latenight, lunch, etc.), mostly containing false values, may not be informative.
- The “BusinessParking” attribute: This attribute Indicates parking options (garage, street, validated, lot, valet). We encoded these options into binary columns and developed a scoring function to reflect the variety of parking options, which needs further validation through model training and evaluation.
Above are some brief visions for what we can do with the attributes in the feature engineering step and next, we can take a look at some attributes and see how the rating would be affected given different values of the attribute.
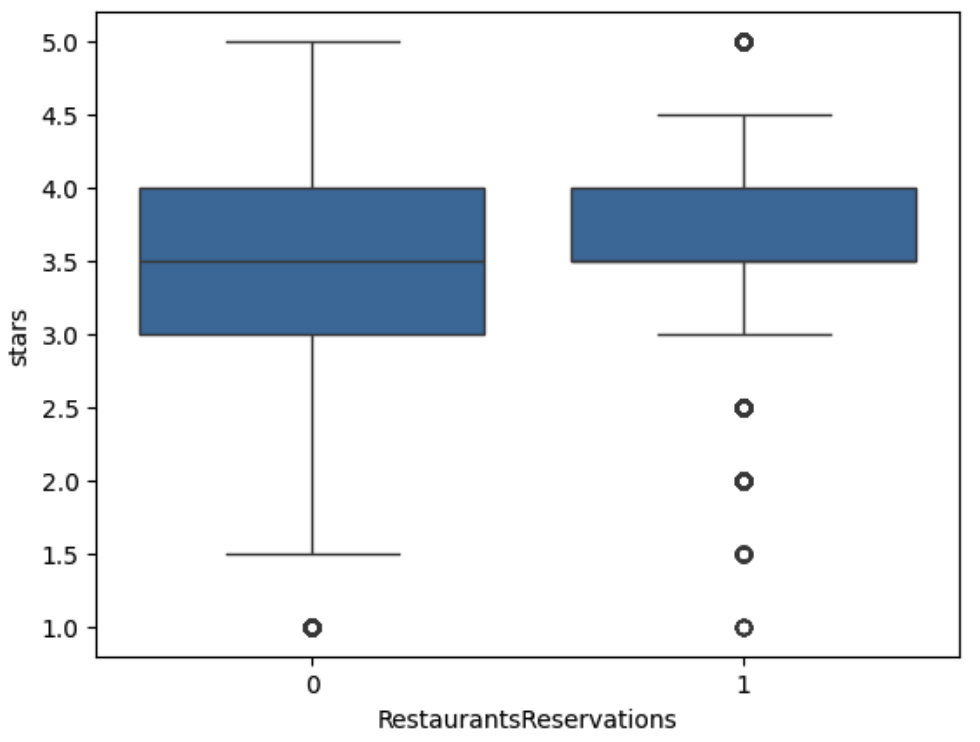
Figure 5. Distribution of stars by RestaurantsReservations
For instance, for the variable “wifi”, the restaurants with no wifi have an average rating of 3.56, those with paid wifi have an average of 3.45 and those with free wifi have an average rating of 3.61. Another example of attributes is whether the restaurant accepts reservations. We can see that restaurants accepting reservations have an average rating of 3.65 while the restaurants not accepting reservations have an average rating of 3.43. The actual comparison can be seen in Figure 5. We can see that the restaurants with reservations also have a smaller variance from the figure. These two examples are just a glimpse of the effect of attributes and how we can use them in our feature engineering step. In the later part of the project, we will examine how different feature engineering and selection techniques can affect the predictive model's performance.
III. Feature Engineering
At the initial stage, we performed some intuitive feature engineering steps including transforming the binary features into 0&1s and giving values to the ordinal variables. Also, we directly included the numerical variables for the businesses and all the features will be used for a preliminary model analysis.
IV. Initial Stage Results
In the initial phase of our data analysis, we adopted a content-based filtering approach as our baseline model, recommending restaurants by identifying feature-based similarities and disregarding user characteristics. We selected foundational features such as 'review_count' and “is_open” from the dataset, focusing on ten specific restaurant categories. For each category, we used one-hot encoding to create binary indicators. For more complex attributes such as “WiFi”, we used a scoring system (2 for "free", 1 for "paid", 0 for "none"). To predict restaurant star ratings, we tested two regression models:
- Linear Regression: Achieved an R² of approximately 0.20 for both training and test sets.
- Random Forest Regression: Showed good fit with an R² of 0.72 on the training set but dropped to 0.21 on the test set, indicating overfitting.
Despite satisfactory training performance, the models tend to overfit, highlighting the limits of using complex models alone to predict user interests. To improve our models, we could:
- Further explore business features, extracting more representative attributes from the data.
- Integrate user features with business features to enhance our system from content-based to collaborative filtering.
- Refine our regression approaches and explore other models suitable for high-dimensional data and large sample sizes.
Analysis (Final Stage)
I. Business Features Extraction
To find more useful features from the business table, we mainly conduct the following feature extraction processes:
- Ordinal Features: As we mentioned in the initial stage exploration, there are many categorical variables with some certain order logic, meaning that they can be represented by ordinal numbers. Besides the “WiFi” feature that we have already included, we include features including “RestaurantPriceRange2”, “NoiseLevel”and “Alcohol”.
- Complex Attributes: As we have mentioned, there are some complex attributes include sub-attributes that we were planning to split and aggregate. However, as we further investigated the features, we found that they tend to have different representations and cannot be processed as an aggregation form. Therefore, we made the sub-attributes of “BusinnessParking” and “Ambience” into separate features in the dataset.
Ultimately, we outputted a dataset of 41 features for each restaurant and we will join them to our final collaborative filtering model.
II. User Features Extraction
For the user data, we in total have a table including 22 variables from 1,987,897 users. As we investigated the table, we found that the table is well established and no missing values are detected in any of the columns. Therefore, we continued to explore and extract features of all the columns to find useful information. The features are as follows:
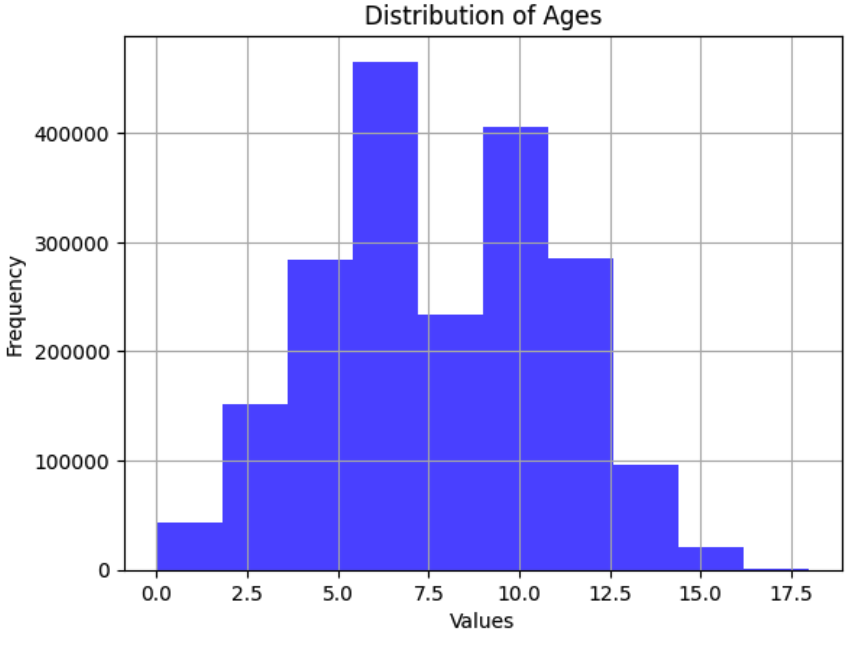
Figure 6. Distribution of user ages in the Yelp dataset
- Review_count: The feature could reveal how many reviews a user gives, illustrating whether the user is a fan of reviewing. Besides, it can help us to filter out the users who don’t ever give a review, indicating that they won’t appear in the “Review” table.
- Yelping_since: The feature indicates the time each user registers for the platform. Using the DateTime data, we extracted the “year” each user registered and calculated the users’ “age” on Yelp. To calculate the age, we simply subtract the “year” from 2022 (the year the data is collected). From the distribution, we can see that they are normally distributed and therefore we can directly use the feature without transforming (see Figure 6).
- Elite: This feature is a string describing the years each user was an elite of Yelp. To extract useful information, we transformed the strings into lists and calculated the length of lists, showing the count of years each user was “Elite”. From the distribution, we can see that most users were never elites, with only a few of them becoming elite for long.
- Friends: The feature is also a string feature displaying all the friends of each user. Similarly, we transformed the strings into lists and calculated the lengths, representing them as the number of friends of each user.
- Other Quantitative Variables: The majority of user variables in the dataset are quantitative and right-skewed, with many significant outliers. For example, the distribution of the number of friends shows that while most users have few friends, some have unusually high numbers. Despite the valuable information outliers may provide, such as indicating influential users, we cannot simply eliminate them. Instead, to address the disparities caused by large values, we rescaled the data using the "Yeo-Johnson" transformation. This adjustment helped normalize distributions and minimize differences, as shown in Figure 7, where the gap between outliers and others significantly reduced.
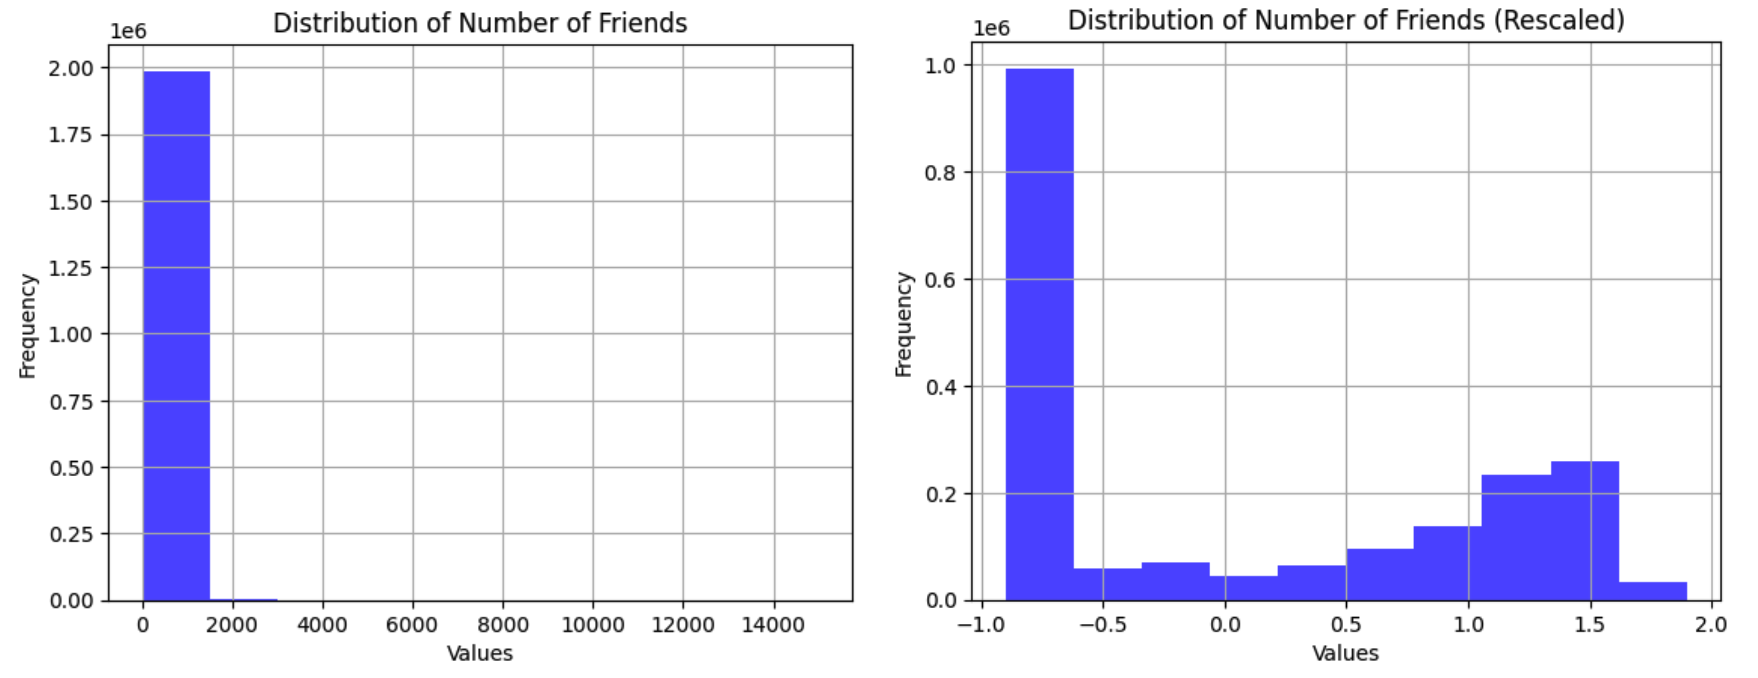
Figure 7. Distribution of the number of friends for users before and after rescaling
Afterwards, we created a dataset of 17 features for each user and similarly we will join them to the collaborative filtering model.
III. Model Building
In the model-building stage, we conducted both content-based and collaborative filtering methods to utilize the Yelp dataset, consisting of user and restaurant features.
- Content-Based Filtering: This method focuses on the restaurant features only, which predicts a user’s preference based on the similarity of restaurants they have previously rated highly. We chose categorical, ordinal, and other attributes from each restaurant as our features, and implemented Linear Regression and Random Forest for prediction.
- Collaborative Filtering: We further improve our content-based approach by leveraging similarities across user preferences and employing the ALS model to predict user ratings. Unlike basic user-based or item-based collaborative filtering that explicitly looks for neighbors (other users or items), ALS infers the latent factors that explain observed ratings and uses these factors to predict missing ratings.
Further, we integrated user and restaurant features in collaborative filtering. Thus, the model could account for both the personal preferences of users and the attributes of the restaurants they interact with.
With these solid approaches, we continue to test and enhance these methods through three experiments which each aimed to further refine our predictive capabilities.
- Experiment 1 – Use a subset of features: This approach is designed to set a benchmark for predictive accuracy using Linear Regression, Ridge Regression, Random Forest, and Elastic Net without complex feature engineering. We deployed these models on a subset of restaurant features including “category”, “tf_attribute” and user features “others”.
- Experiment 2 – Use all the features: Building upon the insights from Experiment 1, this phase aimed to improve model accuracy by incorporating all the available features after extraction, including 'category', “tf_attribute”, “ordinal_attribute”, “BusinessParking_attribute”, “Ambience_attribute”, and “additional” from restaurant features and “review”, “complement”, and “other” from user features.
- Experiment 3 – Apply PCA with all features used: In this phase, we mainly aim to address potential overfitting and improve model efficiency by incorporating data normalization and dimensionality reduction with Principal Component Analysis (PCA). We first applied ‘StandardScaler’ to normalize the features. Later, PCA was employed to reduce the feature space from 83 to a smaller number of principal components which explain at least 95% of the variance in the data.
The progressive refinement of our data modeling techniques through these experiments has advanced our understanding and implementation of the sophisticated restaurant recommendation system. It sets a strong foundation for future enhancements that will focus on real-time adaptability and deeper integration of user feedback.
Results
With respect to the modeling methods and recommendation systems introduced above, we conducted a comprehensive analysis of available features originally provided by the Yelp dataset. We choose Root Mean Squared Error (RMSE) and R-Square (R2) as the two main evaluation metrics. Note that all performance statistics and figures are in the Appendix (Figures 9 & 10).
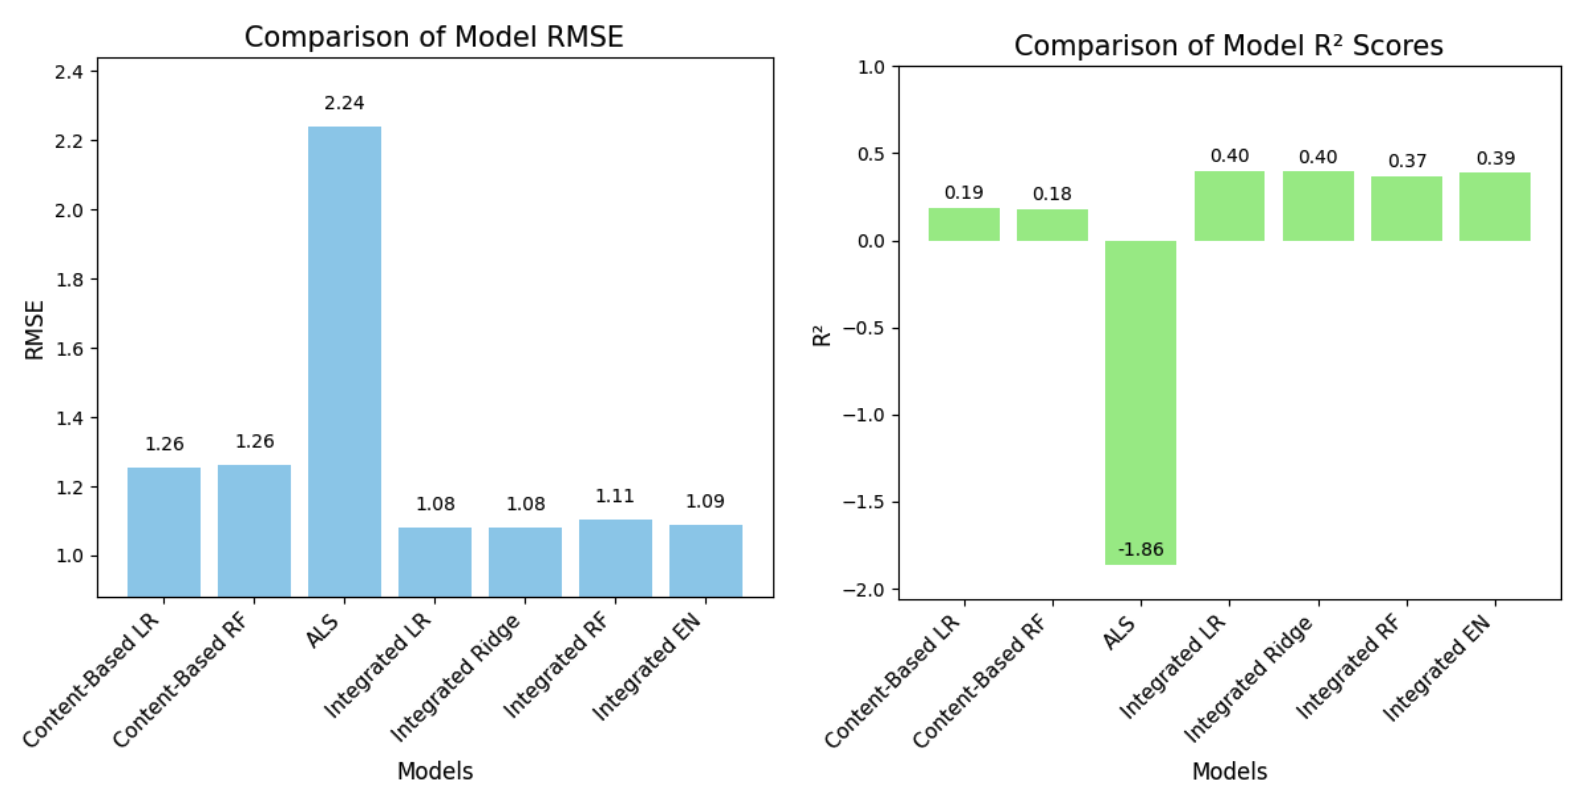
Figure 9. RMSE and R2 results for different types of recommendation systems with different predictive models (LR: linear regression, RF: ridge regression, RF: random forest regression, EN: elastic net)
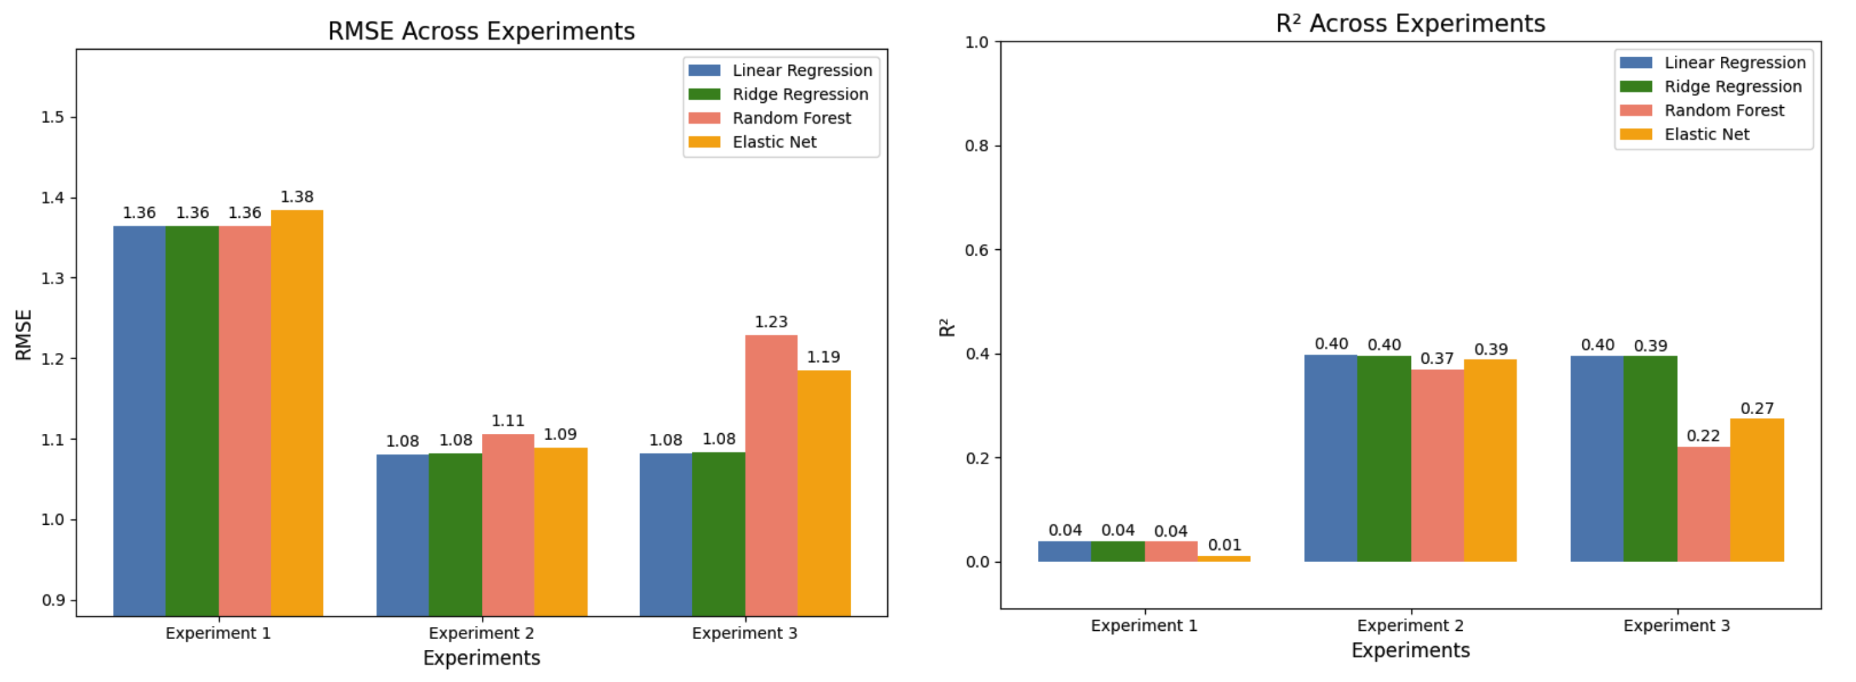
Figure 10. RMSE and R2 results for the different experiments (integrated method)
-
Content-based Filtering: We implemented both Linear Regression and Random Forest models for Content-based Filtering. Random Forest exhibited an RMSE of 1.251 and an R2 value of 0.181, which indicates a moderate level of prediction accuracy with further room for improvement. Linear Regression, on the other hand, achieved a slightly better RMSE of 1.255 and R2 of 0.188, meaning that it is marginally more effective than Random Forest in predicting user preferences, with both lower error and better goodness-of-fit to the variance in this dataset.
-
Collaborative Filtering: We implemented ALS as our collaborative filtering algorithm to construct the recommendation systems, intended to predict user preferences by analyzing patterns of ratings across users and restaurants. It achieves an RMSE of 2.239 and a notably negative R2 value of -1.861, which reflects a certain level of inability to generalize beyond the training data under the constraints of our feature selection and model parameters.
-
Integrated Models: We also explored integrated models that combined user and restaurant features into prediction. Leveraging all features, we implemented Linear Regression, Ridge Regression, Random Forest, and Elastic Net models, observing that the Ridge Regression model yielded the most promising results with the lowest RMSE of 1.081 and the highest R2 of 0.396, indicating a robust performance relative to others.
Regarding Integrated Collaborative Filtering, we experimented with the integrated user and restaurant features in multiple configurations, aiming to enhance our recommendation system:
- When using only a subset of all the features (Experiment 1), the models generally achieved moderate results, with Elastic Net performing slightly worse than others in terms of a relatively high RMSE (1.384) and a low R2 value (0.010). According to Figure 10, it is obvious that the results for Experiment 1 are relatively worse than the other two experiments (with higher RMSE and lower R2). This suggests that the limited feature set might not have captured enough variability to make accurate predictions.
- On the other hand, when incorporating Principal Component Analysis (PCA) aiming to reduce dimensionality, the models demonstrated a bit varied yet overall moderate performances. The Linear Regression model and Ridge Regression performed notably better compared to the other three models, as evidenced by both lower RMSE and higher R2 values, suggesting that these models were more effective in capturing and predicting the underlying patterns in the data when dimensionality reduction (PCA) was applied along with the use of all features.
Conclusion
- This project explores various modeling techniques for the purpose of better predicting new restaurants that a user might be interested in and developing a recommendation system accordingly, using the Yelp dataset encompassing a vast amount of restaurant features and user review data.
- Linear Regression and Random Forest remain the best over the other two models, regardless of the recommendation systems (either content-based filtering or collaborative filtering). With Linear Regression performing even slightly better than Random Forest (achieving slightly lower RMSE and higher R2), it is suggested that simpler models might sometimes be more effective in handling certain types of data distributions.
- The poor performance of the ALS model suggests that Collaborative Filtering, compared to Content-based Filtering, does not work well with the Yelp dataset. It illustrates the difficulties of applying collaborative filtering to sparse and complex datasets, as well as severe problems with overfitting, indicated by the noble negative R2 value.
- The experiments with different feature sets revealed that a full feature set (Experiment 2) generally provides a better basis for model predictions compared to a limited subset (Experiment 1). The integrated approach using Ridge Regression demonstrated the best overall performance, highlighting the benefits of combining diverse data sources. This suggests that a more nuanced model that includes various user and restaurant attributes can enhance prediction accuracy.
Based on our analysis and results, some future improvements could focus on exploring other predictive models and ML techniques to potentially improve the handling of non-linear relationships and interaction effects among features; integrating additional data types such as restaurant locations or user reviews over time to leverage other techniques (such as NLP) and enhance the personalization of the recommendations; incorporating graph-based techniques (such as community detection algorithms) to better identify user clusters, capture user behavioral patterns and obtain insights into user preferences; obtaining data from other sources to interact with other platforms and enhance our recommendation system.